Image Details
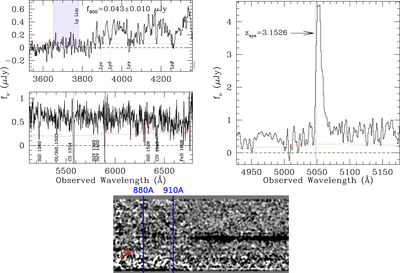
Caption: Figure 1.
Top: deep LRIS spectrum of Q1549-C25. The spectrum is presented in the observed frame, and the flux-density units are μJy. The error spectrum is plotted in red. Blue- and red-side spectra are joined together at the 5000 Å dichroic cut-off. Top left: the top panel shows the LyC range (880−910 Å), indicated as a blue shaded region, and Lyman-series absorption lines. f900 is evaluated as the mean flux density in the LyC region. The bottom panel shows the spectral range longward of Lyα, containing several labeled interstellar metal absorption lines. Top right: zoomed-in spectrum of Lyα emission. The Lyα profile profile is characterized by a single emission peak offset relative to the systemic redshift of Q1549-C25, indicated by the vertical dotted line. Bottom: two-dimensional spectrum of Q1549-C25, with the LyC region bracketed by vertical blue lines at rest wavelengths of 880 and 910 Å. Wavelength increases from left to right and the spatial scale is indicated with a vertical bar of 5″ in extent. The spectrum has been lightly smoothed by a Gaussian kernel with a 3 pixel radius.
Other Images in This Article
Copyright and Terms & Conditions
© 2016. The American Astronomical Society. All rights reserved.