Image Details
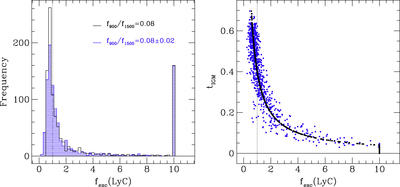
Caption: Figure 5.
Distribution of fesc(LyC) for Q1549-C25. fesc(LyC) is estimated based on the observed ﹩{f}_{900}/{f}_{1500}﹩, an assumed intrinsic ratio, ﹩{L}_{900}/{L}_{1500}=0.20﹩, and 1000 simulated realizations of IGM+CGM transmission in the LyC region at z = 3.15. In each panel, black symbols result from assuming no measurement uncertainty in ﹩{f}_{900}/{f}_{1500}﹩, while blue ones assume the observed error of 0.02. Values of ﹩{f}_{{\rm{esc}}}({\rm{LyC}})\gt 10﹩ (i.e., resulting from low tIGM) have been fixed at 10, and fesc(LyC) = 1 is indicated as a vertical dotted line. Left: Histogram of fesc(LyC) for Q1549-C25. fesc(LyC)﹩\leqslant ﹩ 1 corresponds to 45% of the realizations. Right: Joint distribution of tIGM vs. fesc(LyC). With the assumption of no error bar in ﹩{f}_{900}/{f}_{1500}﹩, there is a one-to-one relation between tIGM and fesc(LyC).
Other Images in This Article
Copyright and Terms & Conditions
© 2016. The American Astronomical Society. All rights reserved.