Image Details
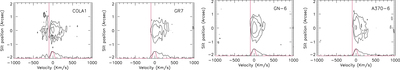
Caption: Figure 4.
Two-dimensional spectra of the LAEs. Lyα luminosity decreases from left to right. COLA1 (﹩\mathrm{log}L({\rm{Ly}}\alpha )=43.9\ \mathrm{erg}\ {{\rm{s}}}^{-1}﹩) shows a clear blue extension, CR7 (﹩\mathrm{log}L({\rm{Ly}}\alpha )=43.8\ \mathrm{erg}\;{{\rm{s}}}^{-1}﹩) does not show a clear sharp velocity edge, and the two lower-luminosity objects (GN-6 with ﹩\mathrm{log}L({\rm{Ly}}\alpha )=43.3\ \mathrm{erg}\;{{\rm{s}}}^{-1}﹩) and A370-6 with ﹩\mathrm{log}L({\rm{Ly}}\alpha )=43.2\ \mathrm{erg}\ {{\rm{s}}}^{-1}﹩) show the sharp razor-edge cutoff typical of lower-luminosity objects at this redshift. In all cases the zero velocity is shown at the Lyα peak and the vertical red line marks ﹩-100\ \mathrm{km}\;{{\rm{s}}}^{-1}﹩. The contours drop by a multiplicative factor of two. At the bottom we show the line profile (black) and the spectral resolution profile (red) centered at ﹩0\ \mathrm{km}\;{{\rm{s}}}^{-1}﹩.
Other Images in This Article
Copyright and Terms & Conditions
© 2016. The American Astronomical Society. All rights reserved.