Image Details
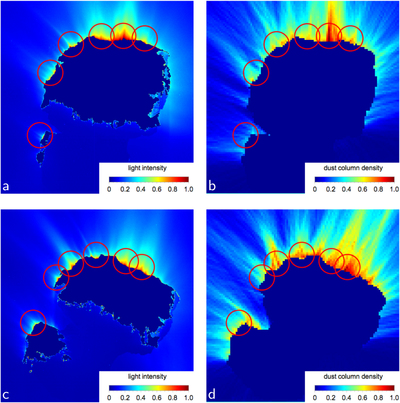
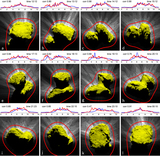
Caption: Figure 4.
Comparison of Rosetta observations with the dust model. OSIRIS NAC observation on (a) 2015 April 12 at 12:12, (c) 13:12 and calculated dust column densities (b,d) not intersecting the nucleus, with the highest column density set to 1.0. OSIRIS data has been linearly stretched and resulting overexposed pixels on the cometary surface have been set to zero (a, c). The circles mark the highest photographed intensities and matching regions of predicted increased dust column density. Credit for (a, c): ESA/Rosetta/MPS for OSIRIS Team MPS/UPD/LAM/IAA/SSO/INTA/UPM/DASP/IDA.
Other Images in This Article
Copyright and Terms & Conditions
© 2016. The American Astronomical Society. All rights reserved.
Copyright ©
2025 Astronomy Image Explorer. All Rights Reserved.