Image Details

Caption: Figure 3.
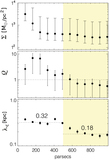
One-dimensional profiles for the best-fit rotation curve k1 and corresponding angular frequency Ω and epicyclic frequency κ, and the non-circular motions up to and including the third order (top panel), all in the plane of the sky. Both frequency curves are defined in Section 2, and they are here divided by five for illustration purposes. The dynamical mass (thick gray curve) accounts for the rotation curve, the HCN σ values shown in the bottom panel, and the assumed ﹩45^\circ ﹩ inclination. The HCO+ σ profile is shown as black diamonds. The shaded area marks the ringlike structure.
Other Images in This Article
Copyright and Terms & Conditions
© 2015. The American Astronomical Society. All rights reserved.
Copyright ©
2025 Astronomy Image Explorer. All Rights Reserved.