Image Details
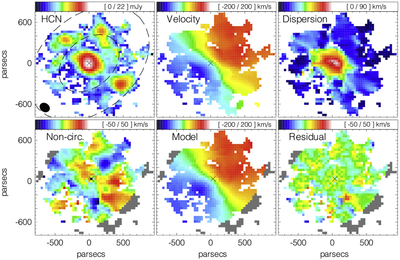
Caption: Figure 2.
HCN ﹩J(4\to 3)﹩ distribution and kinematics (top), and a representation of the non-circular velocities with a harmonic model to quantify their amplitudes and a final residual (data minus harmonic model; bottom). The maps in the top row are results of single-Gaussian fits to the individual spectra. The bottom left panel shows the marginal amplitudes of the non-circular motions, which are results from the fit to the observed velocity field. The cross marks the position of the dynamical center. The filled ellipse in the top left panel shows the synthesized beam size, and the dashed ellipses mark the ringlike structure at ﹩R\sim ﹩ 500–1000 pc. These maps remain consistent for the HCO+ ﹩J(4\to 3)﹩ tracer, but slightly noisier.
Other Images in This Article
Copyright and Terms & Conditions
© 2015. The American Astronomical Society. All rights reserved.