Image Details
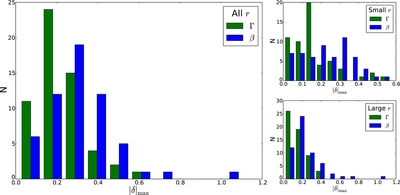
Caption: Figure 5.
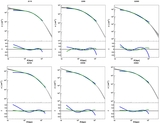
Histograms of the maximum normalized residual |δ| from fitting our model (green) and the β-model (blue) to all clusters. The left-hand panel considers the values of |δ| over the entire radial range of each cluster (20 kpc < r < r500), while the right-hand panels show the distributions using truncated ranges: the central region (top), 20 kpc < r < 400 kpc, and the outer region (bottom), 400 kpc < r < r500.
Other Images in This Article
Copyright and Terms & Conditions
© 2015. The American Astronomical Society. All rights reserved.
Copyright ©
2025 Astronomy Image Explorer. All Rights Reserved.