Image Details
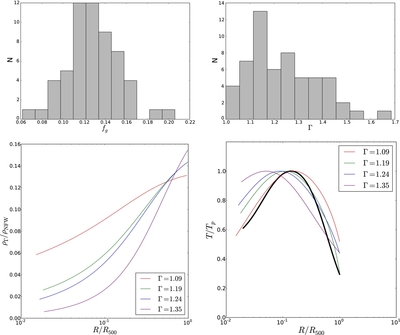
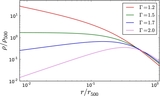
Caption: Figure 2.
Summary of the results of fitting our model to the cluster sample. Top: the distribution of fitted fg (left) and Γ values (right) for the V06 and V09 samples. The parameter s is poorly constrained and thus not included. Bottom: the radial variation of ρΓ/ρNFW (left) and the scaled temperature profiles (right) resulting from a numerical computation using the equation of hydrostatic equilibrium and our density model for four clusters alongside the average temperature profile from V06 in black.
Other Images in This Article

Copyright and Terms & Conditions
© 2015. The American Astronomical Society. All rights reserved.
Copyright ©
2025 Astronomy Image Explorer. All Rights Reserved.