Image Details
Caption: Figure 3.
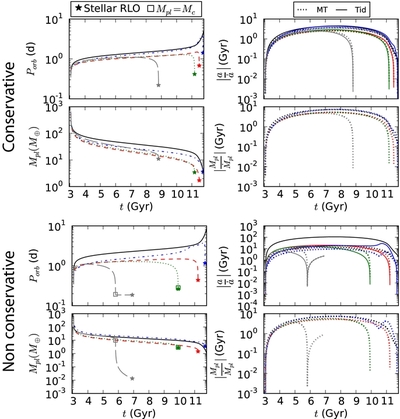
Orbital evolution examples for conservative (top four panels) and non-conservative (bottom four panels) MT. For the latter, β = 0.2 for the polytrope, J1e, J3e, and J10e, and β = 0.4 for J3ei, while α = 1. The different models are identified by color and line style on the left (as in Figure 2) and color on the right. The black lines are for the polytrope. Each set of four panels on the left are Porb (top) and Mpl (bottom), while on the right are the timescales for the evolution of a (top) and Mpl (bottom) due to MT (dotted lines) and tides (solid lines).
Other Images in This Article
Copyright and Terms & Conditions
© 2014. The American Astronomical Society. All rights reserved.
Copyright ©
2024 Astronomy Image Explorer. All Rights Reserved.