Image Details
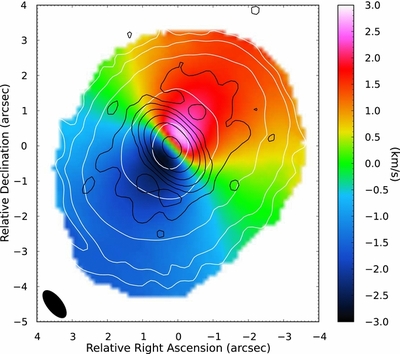
Caption: Figure 1.
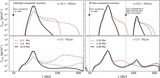
First-moment map of CO J = 3–2 emission (color map) overlaid with integrated intensity contours (in white) and 870 μm continuum emission contours (in black). The intensity contours correspond to 3, 10, 30, 100, and 300 times the rms (30 mJy beam−1 km s−1) and the continuum contours correspond to 3, 10, 30, 100, 300, and 1000 times the rms (0.5 mJy beam−1). The CO integrated intensity reaches 5% of its peak value at ≈20 × rms, whereas the continuum emission reaches 5% at ≈60 × rms. The synthesized beam is the same for both observations.
Other Images in This Article
Copyright and Terms & Conditions
© 2014. The American Astronomical Society. All rights reserved.
Copyright ©
2026 Astronomy Image Explorer. All Rights Reserved.