Image Details
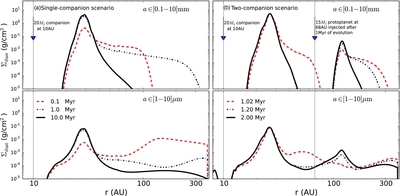
Caption: Figure 5.
Surface density of millimeter-sized and micrometer-sized grains (top and bottom rows, respectively) for (a) the single-companion scenario, and (b) the two-companion scenario (left- and right-hand panels, respectively). The surface density for case (a) is plotted after 0.1, 1.0, and 10 Myr (red, blue, and black lines, respectively) of evolution. The surface density for case (b) is plotted after 0.02, 0.2, and 1 Myr (red, blue, and black lines, respectively) of evolution following the injection of the protoplanet at 1 Myr.
Other Images in This Article
Copyright and Terms & Conditions
© 2014. The American Astronomical Society. All rights reserved.
Copyright ©
2024 Astronomy Image Explorer. All Rights Reserved.