Image Details
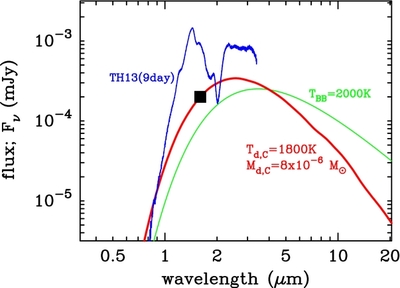
Caption: Figure 3.
Thermal emission spectrum of carbon grains with 1800 K (red) in the observer frame. The black square is the observed NIR flux of GRB 130603B (Tanvir et al. 2013). For reference, a spectrum of the r-process model (blue; Tanaka & Hotokezaka 2013, TH13) and a blackbody spectrum with T = 2000 K (green) are shown. The spectral shape of the dust emission is smoother than that of the r-process model. Note that the parameters of TH13 are not optimized for GRB 130603B.
Other Images in This Article
Copyright and Terms & Conditions
© 2014. The American Astronomical Society. All rights reserved.
Copyright ©
2025 Astronomy Image Explorer. All Rights Reserved.