Image Details
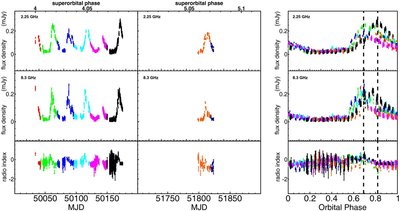
Caption: Figure 4.
Left and middle panels: light curves of 2.25 GHz (top panel), 8.3 GHz (middle panel), and radio index (bottom panel) during the superorbital phase 0.0–0.1. The superorbital phase is shown as the upper axis on top of the panels. Right panel: folded orbital light curve of 2.25 GHz (top panel), 8.3 GHz (middle panel), and radio index (bottom panel) during the superorbital phase 0.0–0.1. The two peaks reported in Massi & Kaufman Bernadó (2009) are shown with dashed black lines. Different orbits (orbital phase 0.0–1.0) are shown with different colors.
Other Images in This Article
Copyright and Terms & Conditions
© 2014. The American Astronomical Society. All rights reserved.
Copyright ©
2026 Astronomy Image Explorer. All Rights Reserved.