Image Details
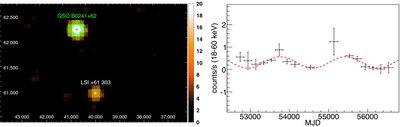
Caption: Figure 1.
Left panel: mosaic image of the LS I +61°303 sky region, derived by combining all INTEGRAL/ISGRI data. QSO 0241+622 is the brighter source (at the upper part of the image) and the relatively faint one is LS I +61°303. Corresponding significances and color can be found in the color bar to the right. The contours start at a detection significance level of 6σ, with each step being 2σ. The X- and Y-axes are R.A. and decl. in units of degrees. Right panel: long-term light curve of LS I +61°303 in 18–60 keV binned in 200 days. The dotted red line indicates a sinusoidal fitting with the superorbital period fixed.
Other Images in This Article
Copyright and Terms & Conditions
© 2014. The American Astronomical Society. All rights reserved.
Copyright ©
2026 Astronomy Image Explorer. All Rights Reserved.