Image Details
Caption: Figure 4.
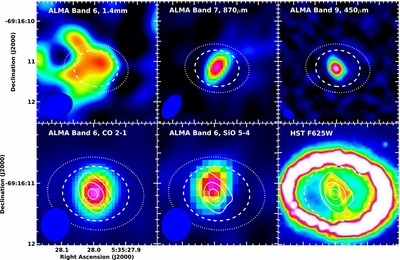
Inner ejecta of SN 1987A. The top row shows the ALMA images with the torus subtracted (location marked by the dotted ellipse).
The bottom row shows the ALMA integrated images of emission from carbon monoxide and silicon oxide (Kamenetzky et al. 2013,
0.57 × 0
![]() 5 beam) and an
HST F625W (optical) image (image courtesy of R. Kirshner and the SAINTS collaboration) with 450 μm contours. The 450 μm emission
has the same north/south elongation as the optical and NIR (Larsson et al. 2013) emission, and the 450 μm peak may correspond
to a hole in the optical emission. Images are not at the same intensity scale; the dashed line is the location of the reverse
shock (Michael et al. 2003; France et al. 2010).
5 beam) and an
HST F625W (optical) image (image courtesy of R. Kirshner and the SAINTS collaboration) with 450 μm contours. The 450 μm emission
has the same north/south elongation as the optical and NIR (Larsson et al. 2013) emission, and the 450 μm peak may correspond
to a hole in the optical emission. Images are not at the same intensity scale; the dashed line is the location of the reverse
shock (Michael et al. 2003; France et al. 2010).
Other Images in This Article
Copyright and Terms & Conditions
© 2014. The American Astronomical Society. All rights reserved.