Image Details
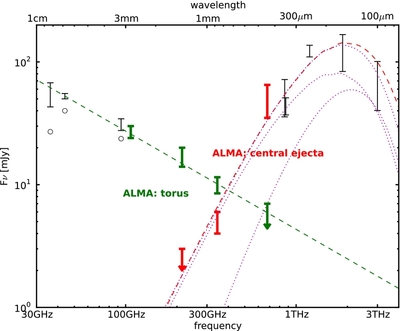
Caption: Figure 3.
Spatially separated ALMA flux densities of the torus (green) and inner ejecta (red). Previous measurements are marked in black (Potter et al. 2009; Zanardo et al. 2013; Lakićević et al. 2012a, 2012b; Matsuura et al. 2011). Measurements at longer wavelengths dominated by shock emission have been scaled to the epoch of the ALMA observations according to the light curve F ν∝e (( t − 5000)/2231) at 44 GHz (Zanardo et al. 2010); the original flux densities at their epochs of observation are shown as open circles. The spectral energy distribution (SED) of the torus is a power law F ν∝ν α with a single index α = −0.8 ± 0.1 (green dashed line). The SED of the inner ejecta is fit well by a model of dust emission—shown here is 0.23 M ☉ of amorphous carbon dust at 26 K (red dashed line), and a combination of amorphous carbon and silicate dust (0.24 M ☉ and 0.39 M ☉ respectively, both at 22 K, two lower magenta dotted lines sum to the upper dotted line).
Other Images in This Article
Copyright and Terms & Conditions
© 2014. The American Astronomical Society. All rights reserved.