Image Details
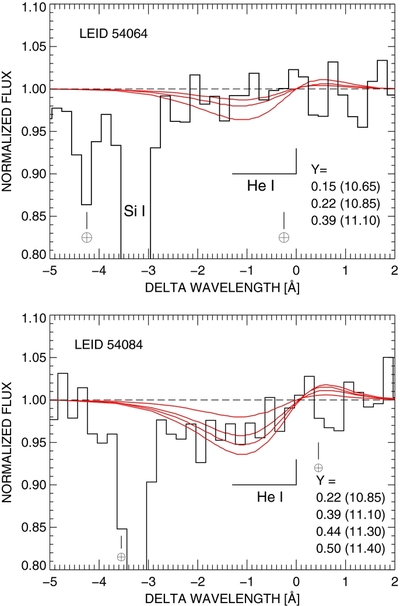
Caption: Figure 3.
Observed helium lines binned to a resolution element in the two matched red giants with the 10830 Å profile as calculated for several values of the helium abundance (shown by a solid smoothly varying line that is colored red in the electronic edition). Values of Y are given for the calculated curves arranged top to bottom and the corresponding log ( n He/ n H) is shown in parentheses where log n H = 12.00.
Other Images in This Article
Copyright and Terms & Conditions
© 2013. The American Astronomical Society. All rights reserved.
Copyright ©
2025 Astronomy Image Explorer. All Rights Reserved.