Image Details
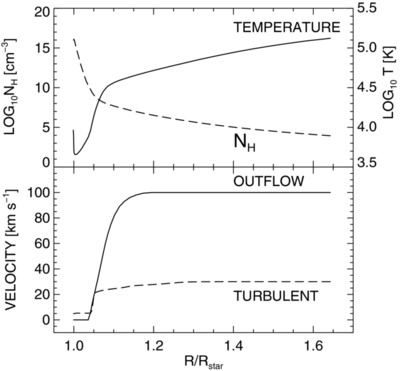
Caption: Figure 2.
Final model. The top panel displays the total hydrogen density (left axis) and the temperature (right axis). The lower panel shows the turbulent and outflow velocities needed to match the observed profiles.
Other Images in This Article
Copyright and Terms & Conditions
© 2013. The American Astronomical Society. All rights reserved.
Copyright ©
2025 Astronomy Image Explorer. All Rights Reserved.