Image Details
Caption: Figure 4.
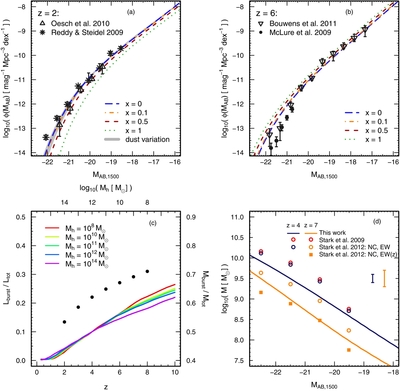
((a) and (b)) Impact on the z = 2 and z = 6 LFs given by varying the relative contribution of burst to galaxy luminosity. Values x ![]() 1 give overall a good description of the observed LFs, while x ~ 1 underestimates the LF at low z. Additionally, in panel (a), the impact of variation of
1 give overall a good description of the observed LFs, while x ~ 1 underestimates the LF at low z. Additionally, in panel (a), the impact of variation of  by ±30% is shown as gray area. (c) Contribution of the burst mode to the total UV luminosity as a function of redshift and halo mass (bottom left axis) and to the total stellar mass as a function of halo mass, since there is no redshift dependence (top right axis). (d) Stellar masses as a function of UV luminosity for z ~ 4 and 7 (NC: nebular contamination corrected data with equivalent width evolution (EW(z)) and without (EW), respectively).
Other Images in This Article

Copyright and Terms & Conditions
© 2013. The American Astronomical Society. All rights reserved.