Image Details
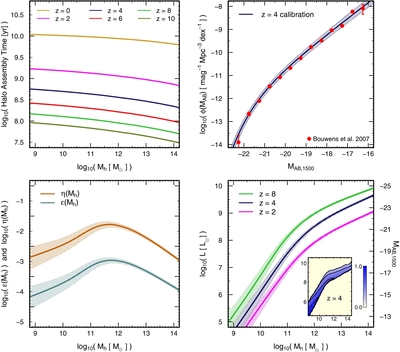
Caption: Figure 3.
Top left panel: DM halo assembly time tage vs. halo mass and redshift. Top right panel: calibration of our model using the Bouwens et al. (2007) LF at z = 4. Bottom left panel: star formation efficiencies η(Mh) and ε(Mh) for the burst and accretion mode, respectively. The highest efficiencies are in the range Mh ~ 1011–1012 M☉. Bottom right panel: the relation between galaxy luminosity and DM halo mass, L(Mh, z), plotted at z = 2, 4, and 8. The inset shows the scatter in the L(Mh, z) relation at z = 4 produced by sampling the whole probability distribution of halo assembly times. In all panels, shaded areas represent 68% confidence regions.
Other Images in This Article
Copyright and Terms & Conditions
© 2013. The American Astronomical Society. All rights reserved.