Image Details
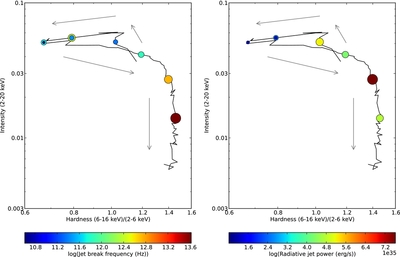
Caption: Figure 3.
HID of the outburst, with marker size and color indicating the inferred jet break frequency (left; double circles indicate ranges inferred) and jet luminosity (right). The arrows represent temporal evolution.
Other Images in This Article
Copyright and Terms & Conditions
© 2013. The American Astronomical Society. All rights reserved.
Copyright ©
2026 Astronomy Image Explorer. All Rights Reserved.