Image Details
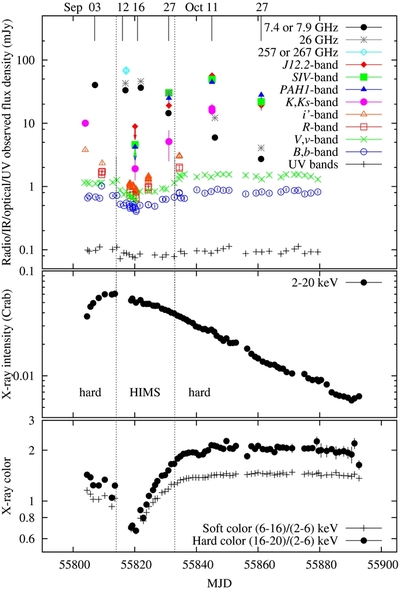
Caption: Figure 1.
Upper panel: radio, IR, optical, and UV light curves of the 2011 outburst of MAXI J1836−194. Where error bars are not visible they are smaller than the symbols. As well as VLT/VISIR mid-IR, FT optical, and Swift UVOT optical/UV data ( v band, b band, and the average flux of the three UV filters, w1, m2, and w2) we also include i′- and K S-band fluxes on August 30 (MJD 55803) from Rau et al. (2011). Center panel: X-ray ( RXTE) light curve. Lower panel: X-ray color (two intensity ratios are given). The vertical dashed lines illustrate state transition dates (from Ferrigno et al. 2012).
Other Images in This Article
Copyright and Terms & Conditions
© 2013. The American Astronomical Society. All rights reserved.