Image Details
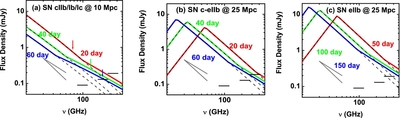
Caption: Figure 2.
Spectral evolution of the model shown in Figure 1 (with γ fl = 200) at different epochs. The characteristic synchrotron cooling frequency is indicated by arrows for each snapshot for the model with A * = 4 ("cIIb/Ib/Ic"). For the other models, the cooling frequency is below the frequency range shown here. In each snapshot, a dashed curve represents the model without flattening. On the left bottom corner, the power-law behaviors are illustrated for the cooling-dominated synchrotron spectrum with p = 3 (derived in cm observations for a majority of SNe cIIb/Ib/Ic) and p = 2 (expected above the spectral flattening energy). The ALMA 5σ continuum sensitivities with an exposure of 1 hr are shown by a black solid line in each band.
Other Images in This Article
Copyright and Terms & Conditions
© 2013. The American Astronomical Society. All rights reserved.