Image Details
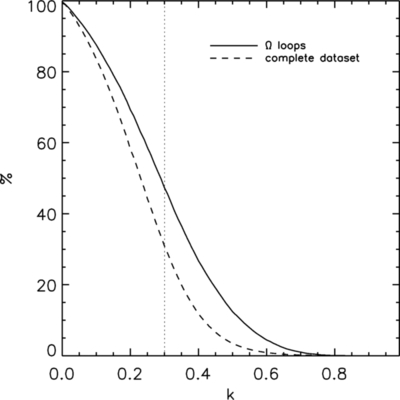
Caption: Figure 3.
Abundances of Stokes V profiles with |δ a| > k as functions of k. The solid line shows the abundances derived at the locations of emergence of magnetic loops; the dashed line shows the ones derived from the complete quiet-Sun data set of all the time sequences when considering the profiles with max(| V|) > 0.006 (consistent with Section 3). The dotted vertical line marks the threshold value here used to evaluate the abundances, i.e., k = 0.3.
Other Images in This Article
Copyright and Terms & Conditions
© 2012. The American Astronomical Society. All rights reserved.
Copyright ©
2025 Astronomy Image Explorer. All Rights Reserved.