Image Details
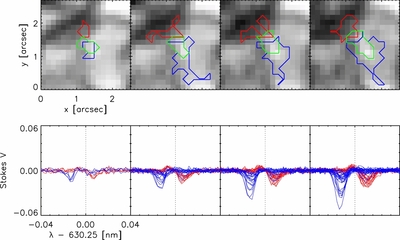
Caption: Figure 2.
Example of an Ω loop emergence event extracted from the analyzed time sequences. Upper row: sub-sequence of Stokes I continuum sub-fields centered around the location of the emergence event. The contours mark the positions of the positive circular polarization signature (red contours), the negative circular polarization signature (blue contours), and the linear polarization signature (green contours). These allow one to point out the emergence event according to the criteria used in Martínez González & Bellot Rubio (2009). The contour regions have areas larger than 4 pixels of Hinode SOT/SP and max(| Q|, | U|) > 8 × 10 −3 and max(| V|) > 6 × 10 −3 (see Section 3). Lower row: Stokes V profiles with |δ a| > 0.3 from the pixels in the locations of the two circular polarization signatures marked by the blue and red contours in the upper row. The colors encode the polarimetric signature from which the profiles were picked.
Other Images in This Article
Copyright and Terms & Conditions
© 2012. The American Astronomical Society. All rights reserved.