Image Details
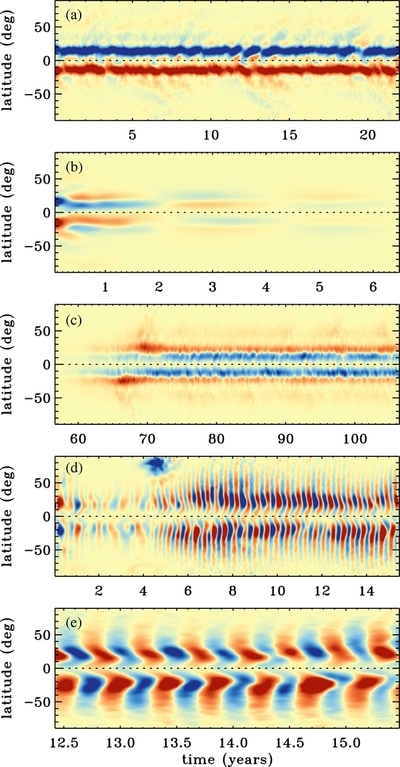
Caption: Figure 2.
Mean toroidal field as a function of latitude and time as in Figure 1(d) (same radial level, color scale, saturation ±4 kG) with (a) α 0 = 1 m s −1, (b), (c) α 0 = 10 m s −1, and (d), (e) α 0 = 100 m s −1. Frame (c) represents a continuation of frame (b) at much later times. Frame (e) is a zoomed-in portion of frame (d) highlighting the magnetic cycles.
Other Images in This Article

Copyright and Terms & Conditions
© 2012. The American Astronomical Society. All rights reserved.
Copyright ©
2025 Astronomy Image Explorer. All Rights Reserved.