Image Details
Caption: Figure 1.
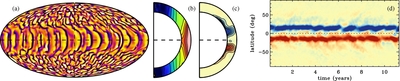
Progenitor simulation, Case D3, from Brown et al. (2010). (a) Radial velocity in a Mollweide projection near the top of the
computational domain (
r = 0.953
R,
t = 2 yr, color table saturation ±70 m s
−1, yellow/orange upflow, blue/black downflow). (b) Angular velocity Ω/2π, averaged over 1200 days (7.8–11.3 yr, saturation
1140–1320 nHz, white/red fast, blue/black slow). (c) Mean toroidal magnetic field
![]() B
ϕ
B
ϕ
![]() averaged over longitude and time (15 day average near
t = 2 yr, saturation ±8 kG, red positive, blue negative). (d)
averaged over longitude and time (15 day average near
t = 2 yr, saturation ±8 kG, red positive, blue negative). (d)
![]() B
ϕ
B
ϕ
![]() in the mid convection zone (
r = 0.84
R) vs. latitude and time (colors as in (c), saturation ±4 kG).
in the mid convection zone (
r = 0.84
R) vs. latitude and time (colors as in (c), saturation ±4 kG).
Other Images in This Article

Copyright and Terms & Conditions
© 2012. The American Astronomical Society. All rights reserved.