Image Details
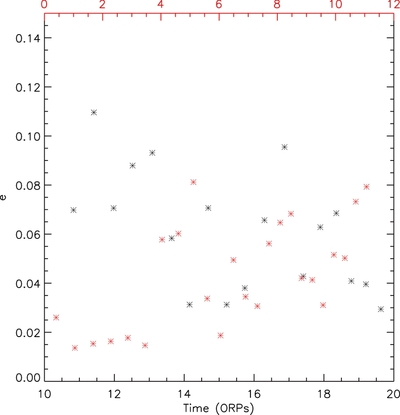
Caption: Figure 3.
Plot of the eccentricities, e, computed for each 0 to 2ϕ change in azimuth of the planet as explained in the text, as a function of time. The diamonds and stars (colored red and black in the online version) indicate the points ( e) and horizontal scales ( t) that correspond to the t = 0 and t = 10 planet runs, respectively.
Other Images in This Article
Copyright and Terms & Conditions
© 2011. The American Astronomical Society. All rights reserved.
Copyright ©
2025 Astronomy Image Explorer. All Rights Reserved.