

Image Details
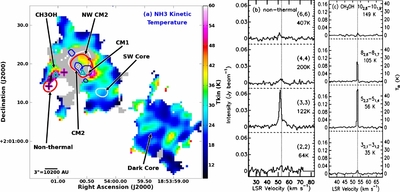
Caption: Figure 3.
(a) Color scale of the NH
3 kinetic temperature using fitting method (1): gray areas indicate where the assumptions for this technique are invalid. The
blue, red, and white contours show the lowest 3.6 cm contour from Figure
2, highest (3,3) contour from Figure
2(c), and highest (1,1) contour from Figure
1(a), respectively. The locations of the profiles shown in (b), for the non-thermal NH
3 emission (18
h54
m01
 119, +02°01′14
 08), and (c) the stronger 25 GHz CH
3OH maser (18
h54
m01
076, +02°01′16
47) are indicated along with other positions fitted with method (2) and presented in Table 2. In (b) and (c), the vertical
dotted line marks the local standard of rest (LSR) velocity of +53.1 km s
−1.
08), and (c) the stronger 25 GHz CH
3OH maser (18
h54
m01
076, +02°01′16
47) are indicated along with other positions fitted with method (2) and presented in Table 2. In (b) and (c), the vertical
dotted line marks the local standard of rest (LSR) velocity of +53.1 km s
−1.
Other Images in This Article
Copyright and Terms & Conditions
© 2011. The American Astronomical Society. All rights reserved.

