

Image Details
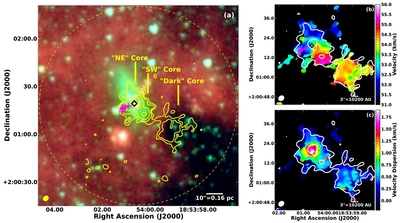
Caption: Figure 1.
(a) Spitzer GLIMPSE three-color image of EGO G35.03 with RGB mapped to 8.0, 4.5, and 3.6 μm overlaid with the EVLA primary beam (yellow dashed circle). Yellow contours show the NH 3 (1,1) integrated intensity (contours at 16, 28, 56, and 102 mJy beam −1 km s −1). The three brightest NH 3 cores are labeled for reference. Magenta "+" symbols and a single black "◊" mark the locations of the 44 and 6.7 GHz CH 3OH masers from Cyganowski et al. (2009). (b) and (c) show the NH 3 (1,1) velocity field (moment 1) and velocity dispersion (moment 2) with the lowest and highest (1,1) integrated intensity contour levels from (a) superposed in white. In all three panels, the EVLA synthesized beam is shown in the lower left.
Other Images in This Article
Copyright and Terms & Conditions
© 2011. The American Astronomical Society. All rights reserved.

