Image Details
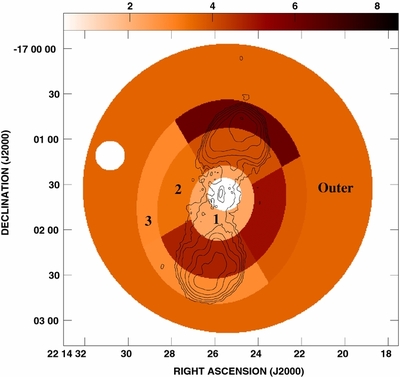
Caption: Figure 3.
Temperature map (in keV) produced using the results of the spectral fits in Table 1 (regions as in Figure 1), with 5 GHz contours overlaid. White regions do not have measured temperatures. The small circle to the east is a contaminating point source excluded from the fits. The regions used in Table 1 are indicated with annulus numbers/region names.
Other Images in This Article
Copyright and Terms & Conditions
© 2011. The American Astronomical Society. All rights reserved.
Copyright ©
2025 Astronomy Image Explorer. All Rights Reserved.