Image Details
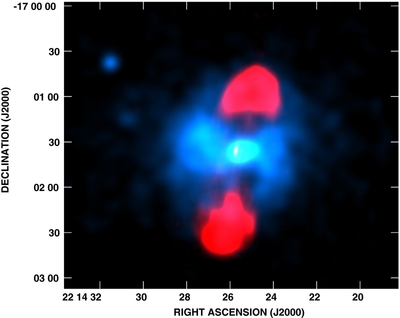
Caption: Figure 2.
Image made from the Chandra data (shown in blue, smoothed with a Gaussian of σ = 15 pixels) and the 5 GHz VLA map (shown in red), indicating the relationship between the radio and X-ray structures, including cavities at the position of the radio lobes, and a sharp elliptical surface brightness drop surrounding the source.
Other Images in This Article
Copyright and Terms & Conditions
© 2011. The American Astronomical Society. All rights reserved.
Copyright ©
2025 Astronomy Image Explorer. All Rights Reserved.