Image Details

Caption: Figure 3.
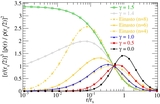
From artificial data sets, ratio of the measured J-factor to the true J-factor, as a function of α int/α c . Lines are color coded with respect to the true value of the slope of the inner density profile of the input model. For these analyses, as for the real dSph data (Section 3), we adopt a uniform prior over 0 ⩽ γ ⩽ 1 for the inner slope. Solid lines indicate median values of the J-factors obtained in our MCMC chains, while dashed/dotted lines indicate lower/upper bounds on 95% CIs.
Other Images in This Article
Copyright and Terms & Conditions
© 2011. The American Astronomical Society. All rights reserved.
Copyright ©
2025 Astronomy Image Explorer. All Rights Reserved.