Image Details
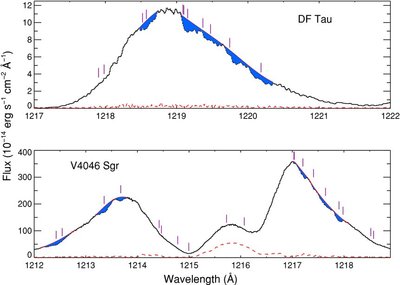
Caption: Figure 2.
Lyα emission profiles of DF Tau (top panel) and V4046 Sgr (bottom panel). The red dashed lines indicate the uncertainty levels, and the vertical ticks mark the wavelengths of coincident Lyman-band H 2 transitions. The blue areas indicate our estimates of the absorption in the H 2 pumping transitions. In the bottom panel, the emission bump centered around 1215.7 Å is geocoronal emission and is not from the star.
Other Images in This Article
Copyright and Terms & Conditions
© 2011. The American Astronomical Society. All rights reserved.
Copyright ©
2025 Astronomy Image Explorer. All Rights Reserved.