Image Details
Caption: Figure 1.
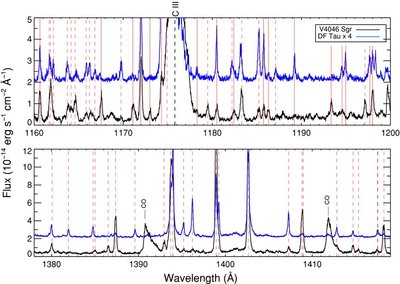
Two portions of the COS G130M spectra of DF Tau and V4046 Sgr. For display purposes, the DF Tau spectrum is scaled up by a factor of four and offset by +2 × 10 −14 erg s −1 cm −2 Å −1. The red dashed vertical lines identify the fluorescent Lyman-band H 2 emission lines and the red solid vertical lines identify the fluorescent Werner-band H 2 lines. The strong emission feature around 1176 Å is the C iii multiplet. Two carbon monoxide (CO) emission features are also marked in the lower panel and will be presented by K. France et al. (2011, in preparation).
Other Images in This Article
Copyright and Terms & Conditions
© 2011. The American Astronomical Society. All rights reserved.
Copyright ©
2025 Astronomy Image Explorer. All Rights Reserved.