Image Details
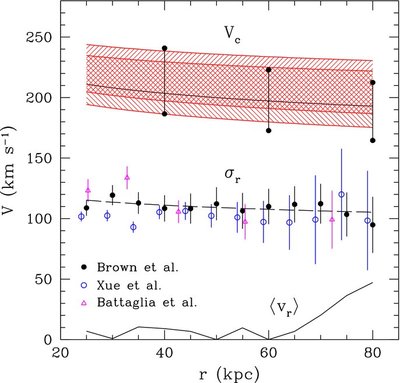
Caption: Figure 2.
Radial velocity dispersion profile of BHB stars from HVS survey (solid circles), from SDSS DR6 (open circles, offset by 1 kpc for clarity), and from a combined sample of globular clusters, satellite galaxies, and halo red giants (triangles). Long dashed line is a power-law fit, σ( r) = 111( r/40) −0.08 km s −1. Solid line shows the mean streaming radial velocity for the HVS sample. Shaded regions illustrate the allowed range of circular velocity when the anisotropy parameter is varied from β = 0 to β = 0.5 for a fixed tracer density γ tr = 4 (bottom left toward top right) and when the tracer density is varied from γ tr = 3.5 to γ tr = 4.5 for a fixed β = 0.4 (top left toward bottom right). Middle solid line is for γ tr = 4, β = 0.4. Filled circles connected by vertical lines show the Watkins et al. (2010) mass estimator applied to the HVS sample at 40, 60, and 80 kpc.
Other Images in This Article

Copyright and Terms & Conditions
© 2010. The American Astronomical Society. All rights reserved.