Image Details
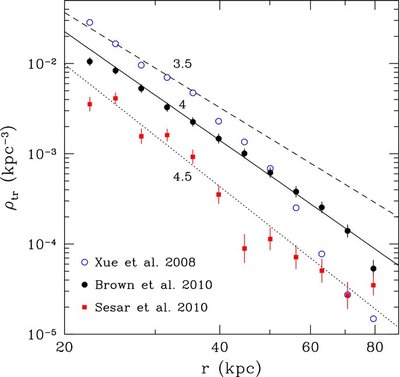
Caption: Figure 1.
Density profile of tracer populations: BHB stars from HVS survey (solid circles), BHB stars from SDSS DR6 (open circles), and RR Lyrae from SDSS Stripe 82 (solid squares). The density is calculated directly from observed counts without correcting for sky incompleteness. The true density is a factor ~5 higher. Errors are from Poisson statistics. Lines show best fits for the logarithmic slope, from 3.5 (dashed) to 4 (solid) to 4.5 (dotted).
Other Images in This Article

Copyright and Terms & Conditions
© 2010. The American Astronomical Society. All rights reserved.
Copyright ©
2025 Astronomy Image Explorer. All Rights Reserved.