Image Details
Caption: Figure 4.
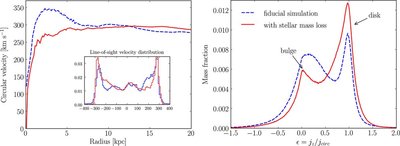
Kinematics in the two simulations. The left panel shows the rotation curves. The prominent bulge in the fiducial run causes
a central bump in the circular velocity profile, while this profile is much flatter for the simulation including stellar mass
loss. In the inset, shown is the radial velocity distribution for the galaxy seen edge-on in both simulations: the FWHM is
used for comparisons with observations of the Tully–Fisher relation. The right panel shows the distribution of the ratio of
the angular momentum of the stars along the
z-axis to the angular momentum they would have on circular orbits: bulge stars are found around
![]() = 0 while disk stars are found around
= 0 while disk stars are found around
![]() = 1. The bulge component is significantly reduced under the effect of stellar mass loss.
= 1. The bulge component is significantly reduced under the effect of stellar mass loss.
Other Images in This Article
Copyright and Terms & Conditions
© 2010. The American Astronomical Society. All rights reserved.