Image Details
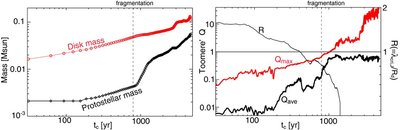
Caption: Figure 3.
Left panel shows actual evolution of protostar mass and disk mass, where the horizontal axis denotes elapsed time in years after the formation of the protostar. The right panel shows time evolution of the gravitational instability indicator Q ≡ κ C S/(π GΣ). Q max is the maximum value in the disk, and Q ave is the average value. The curve labeled R denotes the ratio of the most unstable wavelength to the disk radius. At t ≈ 800 yr, R becomes smaller than unity so that the gravitationally unstable mode is possible in the disk and planetary-mass objects are formed.
Other Images in This Article
Copyright and Terms & Conditions
© 2010. The American Astronomical Society. All rights reserved.