Image Details

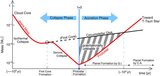
Caption: Figure 1.
Bird's eye-view of the result of non-ideal MHD simulation with nested grid technique, covering the evolution of the molecular cloud core to the protostar. The left panel shows the structure in the grid, level l = 8, where the high-density region ( n = 10 10 cm −3; blue isodensity surface) and magnetic field lines are plotted. Two cocoon-like structures (brown) above and below the flattened core denote the zero-velocity surface inside of which the gas is outflowing from the center. The density contours (color and contour lines) and velocity vectors (thin white arrows) are projected in each wall surface. The right upper panel shows the structure in part of the 10th grid, where we can clearly see the central cavity in the outflowing region. The right lower panel (12th grid) shows the protoplanetary disk in the formation phase and two newly formed planetary-mass objects in the disk.
Other Images in This Article
Copyright and Terms & Conditions
© 2010. The American Astronomical Society. All rights reserved.