Image Details
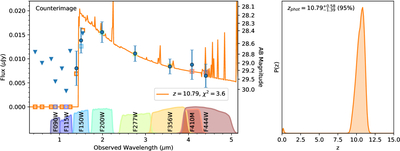
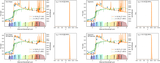
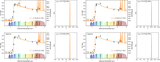
Caption: Figure 9.
Best-fit EAZYPY photometric redshift for the candidate counterimage. The measured fluxes are shown as blue data points or triangle upper limits. Nondetections are plotted as upper limits at the 2σ level. The best-fit EAZYPY SED model is shown in orange, with squares indicating the expected photometry in a given band. In the right-hand panel, we plot the P(z) posterior redshift probability distribution. The candidate counterimage has a best-fit photometric redshift of ﹩{z}_{{\rm{phot}}}=10.{8}_{-1.4}^{+0.6}﹩, which is consistent with the redshift of the Cosmic Gems Arc of zphot = 10.2 ± 0.2.
Other Images in This Article
Copyright and Terms & Conditions
© 2025. The Author(s). Published by the American Astronomical Society.
Copyright ©
2025 Astronomy Image Explorer. All Rights Reserved.