Image Details
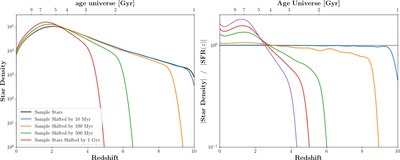
Caption: Figure 12.
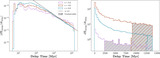
The effect of the delay time on the distribution of stars throughout cosmic history. We use rejection sampling of one million stars to acquire a sample of stars reflecting the assumed SFRD (P. Madau & T. Fragos 2017). Then, we add 10 Myr, 100 Myr, and 1 Gyr to their birth ages. The left panel shows the original distribution and the distributions of the stars shifted by the three different example delay times. In the right panel, we normalize each distribution and then divide by the normalized SFRD. In doing so, we can see how the delay time effects cause the population of stars at low redshift to be greater than the SFRD.
Other Images in This Article
Show More
Copyright and Terms & Conditions
© 2024. The Author(s). Published by the American Astronomical Society.