Image Details
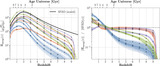
Caption: Figure 1.
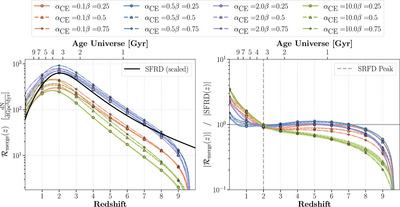
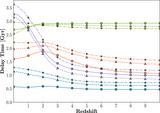
Left: the BBH merger rate as a function of redshift for the α CE and β model variations explored in this paper compared to the SFRD scaled arbitrarily (black line). Right: the BBH merger rate divided by the SFRD, where we normalize the areas of both to one. The horizontal gray line indicates a merger rate that follows the SFRD, and the dashed vertical gray line is the redshift of the SFRD peak. In both panels we include the 1σ and 2σ confidence intervals calculated by bootstrapping the simulation results to show the sampling uncertainty (note that the uncertainties are typically the same size as the width of the lines). The sharp decline in the merger rate at z ∼ 9 is due to star formation starting at z = 10 in our calculations and the fact that mergers are delayed.
Other Images in This Article
Show More
Copyright and Terms & Conditions
© 2024. The Author(s). Published by the American Astronomical Society.