Image Details
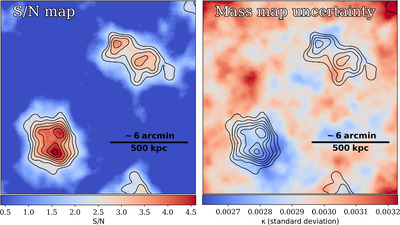
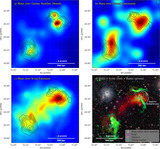
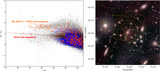
Caption: Figure 8.
S/N and rms maps overlaid with mass contours. Left: mass reconstruction S/N map obtained from 1000 bootstrapped convergence maps. NWE and NWW were detected at the 3.3σ and 3.4σ levels, respectively, whereas SEN and SES were detected at the 4.2σ and 4.7σ levels. Right: mass reconstruction uncertainty map. The values represent the standard deviation from the 1000 bootstrap realizations.
Other Images in This Article
Copyright and Terms & Conditions
© 2024. The Author(s). Published by the American Astronomical Society.
Copyright ©
2025 Astronomy Image Explorer. All Rights Reserved.