Image Details

Caption: Figure 5.
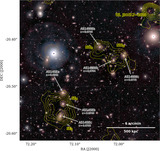
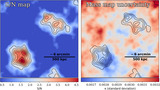
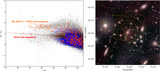
Comparison of the A514 mass distribution with the galaxy, X-ray, and radio distributions. (a) Mass (black) overlaid with the adaptively smoothed galaxy number density. (b) Mass (black) overlaid with the galaxy luminosity in the r band. (c) Mass (black) overlaid with the adaptively smoothed XMM-Newton X-ray emission. (d) Mass (yellow) overlaid with the Magellan color composite + XMM-Newton X-ray (red) + uGMRT band 3 radio (green). The galaxies used in panels (a) and (b) are the spectroscopic and photometric (red-sequence) members. In panel (d), the luminosity peaks marked with orange pentagons are estimated by flux-weighted averaging. The mass centers marked with white triangles are obtained from the first moments of the local convergence values. White dashed contours represent the 68% confidence intervals of the mass centroids determined from 1000 bootstrap realizations (Section 5.1).
Other Images in This Article
Copyright and Terms & Conditions
© 2024. The Author(s). Published by the American Astronomical Society.