Image Details
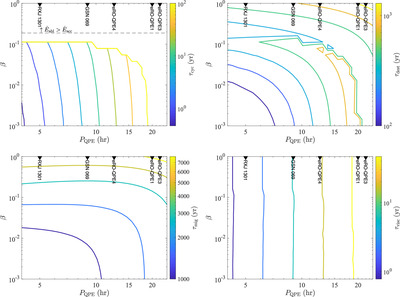
Caption: Figure 6.
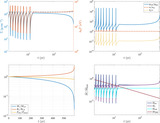
Contours show various key timescales as a function of (half) the orbital period P QPE and the collisional/ablation-heating efficiency β. The periods of some known QPE sources are shown along the top axis. Top left panel: cycle duration (in the case of a thermally unstable solution). For β > β stable or p gas > p rad, the system evolves to thermal equilibrium, and limit cycles disappear (the boundary denoted by the yellow line). Top right panel: stellar destruction time due to mass stripping from disk collisions. Bottom left panel: migration time due to disk-induced drag. Bottom right panel: disk viscous time.
Other Images in This Article
Copyright and Terms & Conditions
© 2024. The Author(s). Published by the American Astronomical Society.