Image Details
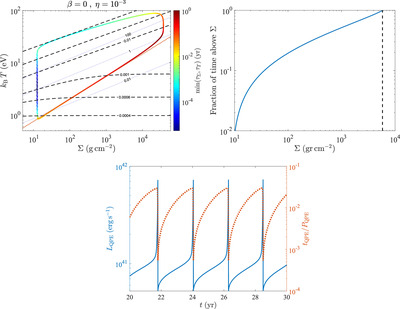
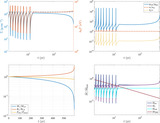
Caption: Figure 3.
Disk evolution for a Sun-like star orbiting a 106 M ⊙ SMBH, in the absence of collision/ablation heating (β = 0) and η = 10−3. Left panel: limit-cycle evolution in the T vs. Σ plane. The color map shows the system’s evolution time along the limit cycle, with its maximal value obtained toward ﹩{{\rm{\Sigma }}}_{\max }﹩ along the lower thermal equilibrium branch. The black-dashed contours correspond to different values of h/r (Equation (16)), and blue-dotted contours correspond to p rad/p gas. The red-dotted line is the analytical expression for the lower thermal equilibrium branch (Equation (25)). Right panel: the fraction of time spent below Σ, as a function of Σ. Bottom panel: QPE eruption luminosity L QPE and duration t QPE (expressed in ratio to the QPE period P QPE), as a function of time, following the analytic estimates of Equations (51) and (50).
Other Images in This Article
Copyright and Terms & Conditions
© 2024. The Author(s). Published by the American Astronomical Society.