Image Details
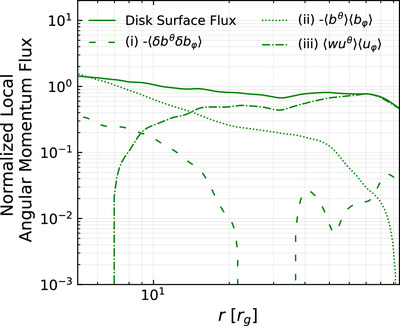
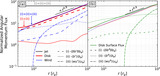
Caption: Figure 6.
We plot the angular momentum flux through the disk surface, analogously to Figure 4(b), but instead of depicting the cumulative integral form of the angular momentum surface flux (Equation (12)), we instead depict the local angular momentum surface flux, ﹩\tfrac{d}{{dr}}{G}_{\varphi }^{\theta }﹩ (see the Appendix). We further break down the local surface angular momentum flux into (i) turbulent Maxwell stresses (〈δ b μ δ b φ 〉; Equation (7)), (ii) large-scale laminar Maxwell stresses (〈bu μ 〉〈b φ 〉; Equation (8)), and (iii) advective transport (〈wu μ 〉〈u φ 〉; Equation (6)), where μ = r, θ. The turbulent Reynolds term is negligible everywhere, and as in Figure 4, we therefore omit it. The dashed, dotted, and dash–dotted lines sum the total local angular momentum flux through the disk surface, denoted by the solid green line.
Other Images in This Article
Copyright and Terms & Conditions
© 2024. The Author(s). Published by the American Astronomical Society.