Image Details
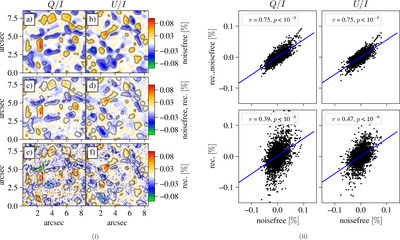
Caption: Figure 3.
Left panels (i): original and reconstructed simulated linear polarization Q/I (left column) and U/I (right column) images. (a)–(b) Noise-free data. (c)–(d) Reconstructed polarization maps from the noise-free images. (e)–(f) Reconstructed polarization maps from the images containing noise. The gray contours indicate a polarization amplitude of 0.02%. Right panels (ii): scatter plots of the reconstructed Q/I (left column) and U/I (right column) amplitudes without (top row) and with (bottom row) noise, against the corresponding polarization amplitude in the original simulation snapshot without noise (but degraded). Only pixels inside the gray contours in panels (i) are considered. The blue lines show the linear fit, the correlation coefficients r and the corresponding p-values are given in the inset.
Other Images in This Article
Copyright and Terms & Conditions
© 2024. The Author(s). Published by the American Astronomical Society.