Image Details
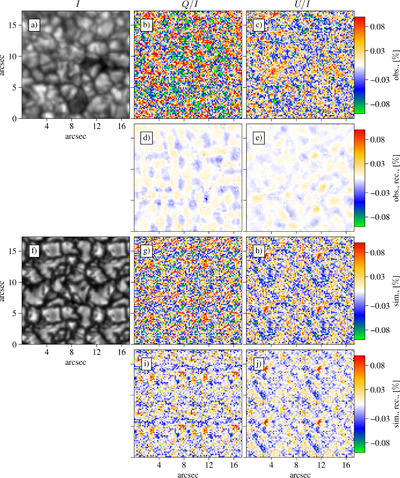
Caption: Figure 1.
Observed and synthetic (degraded to the observation; see text for details) spectrally integrated intensity I and fractional linear polarization Q/I and U/I in the Sr I line around 4607 Å. Observed temporally averaged intensity image (a) and observed Stokes Q/I and U/I, (b) and (c), respectively. (d)–(e) Reconstructed Q/I and U/I spatial maps from the statistical averaged polarization in panels (e)–(f) of Figure 2. The statistical average is based on the ﹩{J}_{2}^{2}﹩ values (see text for details). These maps have been reconstructed by retracing the accumulated polarization values from Figure 2 to their original positions in an observed 5 s integrated image (i.e., to the places with the corresponding ﹩{J}_{2}^{2}﹩ values) and then temporally averaged. Degraded single-snapshot theoretical intensity image (f) and Stokes Q/I and U/I images, (g) and (h), respectively. To facilitate a more straightforward comparison with the observation, the field of view is extended periodically. (i)–(j) The exact same method as for the observed Stokes images (d)–(e) is used to reconstruct the spatial distribution of Q/I and U/I from the statistical averaged polarization in panels (a)–(b) of Figure 2.
Other Images in This Article
Copyright and Terms & Conditions
© 2024. The Author(s). Published by the American Astronomical Society.